by Christine Stricker | Jul 2, 2021

According to ATTOM’s recently released Q1 2021 U.S. Home Flipping Report, both the home flipping rate and gross profits declined nationwide in the first quarter of 2021. With home flips representing just 2.7 percent of all home sales in Q1 2021, the home flipping rate fell to the lowest level since 2000.
ATTOM’s latest home flipping market analysis found that the gross profit on the typical U.S. home flip declined in Q1 2021 to $63,500, translating into a 37.8 percent ROI compared to the original acquisition price. The gross flipping ROI reached its lowest point since the second quarter of 2011.
The report noted that the home flipping rate decreased from Q4 2020 to Q1 2021 in 76 of the 108 metro areas analyzed, commonly dropping from about 5 percent to 3 percent. Metro areas were included in the analysis if they had at a population of 200,000 or more and at least 50 home flips in Q1 2021.
ATTOM’s Q1 2021 home flipping report named those metro areas with the largest quarterly decreases in the home flipping rate. Those markets included Memphis, TN (rate down 80 percent); Lakeland, FL (down 75 percent); San Francisco, CA (down 74 percent); Columbia, SC (down 73 percent) and Palm Bay, FL (down 73 percent).
The report also named those metros with the biggest increases in home-flipping rates. Those areas included Springfield, MA (rate up 114 percent); Albuquerque, NM (up 103 percent); Springfield, IL (up 95 percent); South Bend, IN (up 86 percent) and Boston, MA (up 79 percent).
Also according to ATTOM’s Q1 2021 home flipping report, profit margins dipped from Q1 2020 to Q1 2021 in 66 of the 108 metro areas with enough data to analyze. Those markets with the biggest declines included Savannah, GA (return on investment down 80 percent); Tuscaloosa, AL (down 76 percent); Salisbury, MD (down 73 percent); Evansville, IN (down 71 percent) and Davenport, IA (down 68 percent).
The report also named those metro areas with the biggest quarterly increases in profit margins during Q1 2021. Those markets included Springfield, MO (ROI up 120 percent); Provo, UT (up 118 percent); Omaha, NE (up 101 percent); Lynchburg, VA (up 101 percent) and Pittsburgh, PA (up 88 percent).
Another key takeaway from the ATTOM Q1 2021 home flipping report is that home flippers who sold homes in Q1 2021 took an average of 159 days to complete the transactions. That level was the lowest since Q3 2013, and down from an average of 175 in both Q4 and Q1 2020.
In this post, we take a deep dive into the data behind ATTOM’s latest home flipping report to uncover the top 10 U.S. housing markets with the fastest times to flip in Q1 2021. Among those markets with a population of 200,000 or more and 50 or more home flips in Q1 2021, the top 10 with the fastest flips times include: Nashville-Davidson–Murfreesboro–Franklin, TN (107 days); Atlanta-Sandy Springs-Roswell, GA (115 days); Boise City, ID (116 days); Las Vegas-Henderson-Paradise, NV (117 days); Barnstable Town, MA (123 days); Fayetteville, NC (126 days); Detroit-Warren-Dearborn, MI (128 days); Raleigh, NC (129 days); Greenville-Anderson-Mauldin, SC (129 days); and Sacramento–Roseville–Arden-Arcade, CA (130 days).
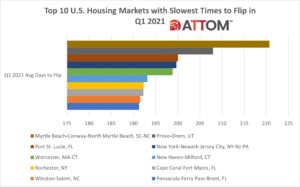
Also in this post, we dive deep into the data behind the ATTOM Q1 2021 home flipping report to uncover the top 10 U.S. housing markets with the slowest times to flip in Q1 2021. Among those markets with a population of 200,000 or more and 50 or more home flips in Q1 2021, the top 10 with the slowest flips times include: Myrtle Beach-Conway-North Myrtle Beach, SC-NC (221 days); Provo-Orem, UT (208 days); Port St. Lucie, FL (200 days); New York-Newark-Jersey City, NY-NJ-PA (200 days); Worcester, MA-CT (199 days); New Haven-Milford, CT (193 days); Rochester, NY (192 days); Cape Coral-Fort Myers, FL (192 days); Winston-Salem, NC (192 days); and Pensacola-Ferry Pass-Brent, FL (191 days).


No comments:
Post a Comment