A Housing Frenzy Is Sparking Bidding Wars From New York to Shenzhen

(Source: bloomberg.com)  

Global property prices are rising at the fastest rate since before the financial crisis.


Bloomberg News
June 30, 2021, 9:00 PM EDT Updated on July 1, 2021, 8:05 AM EDT

Around the world, property markets are going bananas.

From the U.S. to the U.K. to China, housing is riding an extended boom. Global valuations are soaring at the fastest pace since 2006, according to Knight Frank, with annual price increases in double digits. Frothy markets are flashing the kind of bubble warnings that haven’t been seen since the run up to the financial crisis, a Bloomberg Economics analysis shows.

On the ground, outrageous stories are rife, with desperate buyers promising to name their first-born after sellers and derelict buildings selling for mansion prices.

The drivers for the frenzy are remarkably consistent: cheap mortgages, a post-pandemic desire for more space, newly remote workers taking city cash to regional locations — and, crucially, a pervasive fear that if you don’t buy now you may never be able to.

As prices mount, so do the risks for both individuals and society. Even without an outright crash, big mortgages mean borrowers are vulnerable if interest rates rise, have less disposable income to spend in the wider economy and are more likely to retire in debt. For younger people, buying property becomes increasingly difficult, further widening intergenerational inequality.

While regulators are starting to get nervous, there are few signs of meaningful action in most countries. They expect the market will start to cool on its own, arguing that a decade-long focus on higher lending standards combined with the prospect of low interest rates for an extended period means there is no obvious trigger for a crash. Much of the activity is also being driven by owner-occupiers rather than investors, who typically don’t all head for the door at once if prices start to drop.

So for now, expect the wild stories to keep coming. Here are a few of the most startling ones we’ve come across.


Canada

As a real estate agent, Kristin Cripps knew the market was hot in Barrie. Prices in the fast-growing city about an hour and a half’s drive north of Toronto have been pushed skyward as buyers hunt for larger homes or vacation properties on scenic Lake Simcoe.

Yet nothing prepared her for selling her one-bedroom vacation home. It’s not a remarkable property—Cripps says it looks like “a small box” from the outside—but within 24 hours of listing, 192 showings had been booked. And that was only the start.

Throughout the following three days, bidders and agents kept showing up without an appointment, tramping through the snow to bang on the door while Cripps conducted virtual viewings inside.

The property’s narrow driveway became so congested, no fewer than six cars ended up in a ditch and needed to be towed out. At the height of the bidding war, Cripps estimates she was getting about 75 emails every 20 minutes, and didn’t sleep more than two or three hours a night as she tried to keep up with all the inquiries. In the end she received 71 offers. The property, listed for C$399,000 ($328,665), sold for almost twice that sum — C$777,777.

“You know when you see videos of Black Friday and everyone rushes in and they’re grabbing stuff and they’re having fights in the store and pulling people’s hair and there’s security and they’re grabbing people? That’s what it felt like,” Cripps said.

“Everyone was just so hot and bothered to get a property.”


Australia

It didn’t have a kitchen or a toilet or power, let alone flooring or paint. Yet the semi-derelict home about seven kilometers (4.4 miles) south of Sydney’s city center sold anyway—for A$4.7 million ($3.5 million), after a heated bidding war.

It’s just one more jaw-dropping sale in the harborside city, where more than half the houses sold this year fetched at least A$1 million and quarterly gains to May were the highest in more than 30 years. House prices rose by A$1,263 a day in May, while Australia’s housing market just wrapped up its best fiscal year since 2004, figures showed Thursday.

“I’ve been involved in this industry 25 years and seen nothing like it,” selling agent Joe Recep of NG Farah Real Estate said. “We had 30,000 enquiries on the property in four weeks—from UAE [United Arab Emirates], Dubai, America, New Zealand and all the Asian countries."

It’s the top end of the market that’s really motoring. Cashed-up buyers returning from overseas and wealthy locals kept in the country by Australia’s closed borders are prepared to pay eye-watering amounts for a desirable lifestyle.


Sydney's Top-Tier Home Prices Soar

Values rise fastest for the most expensive properties

Sources: Corelogic Inc., Bloomberg

D’Leanne Lewis, a principal at real estate agency Laing+Simmons in the tony eastern suburb of Double Bay, sold homes worth a record A$60 million in a single day in May—more than she had ever previously sold in a month.

Among the five houses Lewis sold on her banner day was an eight-bedroom, nine-bathroom property in Bellevue Hill, an expensive area in the city’s east. It was snapped up pre-auction for $25 million—almost 40% above its advertised price—and more than triple the $7 million it sold for just five years ago. While palatial, it doesn’t have the waterfront views or access you’d normally expect in Sydney at that price.

“It’s crazy but does make sense when you think about it,” says Lewis. “Being locked down in a place like Sydney does not feel so dismal when you compare it to the rest of the world. People are looking for a safe haven.”


U.S.

In the wealthy enclave of Greenwich, Connecticut, you can’t even bank on being able to see a property before you put in an offer.

Shut out of appointments to view a just-listed $1.55 million house, one set of homebuyers decided to make a cash offer above asking price anyway. Their only condition was to be allowed into the house once before signing the contract.

“It was accepted as the highest and best bid, and they’d never been in the house,” said Mark Pruner, a broker with Berkshire Hathaway HomeServices in Greenwich. “There were all these other people lined up for appointments in 15-minute intervals for two days.”


New York's Divided Property Market


Prices in Manhattan keep falling as bidding wars erupt in the outer boroughs.

Source: StreetEasy, Bloomberg, Q1 2021 data, YOY % change


U.S. home prices jumped the most in 30 years in April, with even more dramatic increases in many suburban and rural areas. At the peak of the pandemic, Greenwich attracted exiles from New York City — and they’ve kept coming ever since. Signed contracts for single-family homes more than tripled in May from a year earlier to 165, according to appraiser Miller Samuel Inc. and brokerage Douglas Elliman Real Estate. And that’s after a first quarter when the median price of home sales surged 31% to $2.24 million.

In Manhattan, sales have picked up in recent months too, but that’s largely thanks to the prospect of discounted prices. By contrast, buyers pushing deep into the outer boroughs in search of more spacious homes are facing bidding wars.

Things are even hotter in more remote areas of the U.S. Take Boise, Idaho, a picturesque city of roughly 225,000 set against the foothills of the Rocky Mountains. An influx of buyers from California and other more expensive states has sent the market wild: Prices at the start of June were up 42% from a year earlier, according to brokerage Redfin. In April, eight in 10 offers made by its customers faced bidding wars.

Building a Home in the U.S. Has Never Been More Expensive
An influx of buyers has sent the Boise market wild.
Photographer: Jeremy Erickson/Bloomberg
Desperate buyers are doing whatever they can to secure a deal — including promising not to actually move in. Shauna Pendleton, a local Redfin broker, said one vendor negotiated the right to stay in the property for five months on a peppercorn rent until their new home was built.

“Sellers know they’ve got power in this market, they know they hold the cards and that they pretty much make the rules,” Pendleton said.


U.K.

Buying a U.K. property right now is nerve-jangling. Almost a quarter of homes sell within a week, according to estate agents Hamptons International, many before they even hit the property portals.

The intense competition is leaving would-be-buyers like Alyson Nash, 63, and her husband out in the cold. They sold their family farmhouse last year and moved into rented accommodation so they could hunt commitment-free for a property near Guildford, a commuter hub in England’s southeast.

Eight months later, after making offers for three homes at their asking prices of at least 2.5 million pounds ($3.5 million), they’re no closer.

“I had never in my life anticipated it being this difficult,'' Nash said. “There’s very little on the market and what there is, is being chased down by too many people.”


U.K. House Prices Are Rising Faster Outside London

The capital city isn't attracting buyers the way it once did

Source: Acadata


The booming market has led to the resurgence of a practice known as gazumping. Property deals in the U.K. aren’t legally binding until contracts are formally exchanged, which can take months after an offer has been accepted—particularly when mortgage lenders and lawyers are struggling with high volumes.

At any point in this period sellers can accept a different offer. That’s what happened to Charlotte Howard, 46, in February. Four months later, as glacial proceedings on another property left her terrified of being gazumped again, she found herself contacting the seller on Facebook to reassure them of her interest.

“I’m feeling just a bit broken and a bit bruised,” Howard said. “Things can go wrong still.”

Fortunately for Howard, she and the seller exchanged on June 11th.


China

Reining in property speculation is a key objective of the Chinese government. But even they are struggling. While in much of the world the pandemic spurred a dash to the suburbs and beyond, buyers in China piled into top-tier cities where the best jobs and schools can still be found.

Existing home prices in those cities rose 10.8% in the year to May, despite crackdowns on loopholes such as fake divorces, designed to bypass rules on how many properties a family can own.

In the tech hub of Shenzhen, an apartment costs 43.5 times a resident’s average salary, according to the research institute of real estate firm E-House (China) Enterprise Holdings Ltd. That’s not far behind Hong Kong, the world’s least affordable city. With Shenzhen prices rising faster than anywhere else in China, the list of obstacles facing would-be buyers just keeps getting longer—and more arbitrary.


China's Home Price Gains Slow, But Don't Stop


Increases continue despite tough cooling measures

Source: China's National Bureau of Statistics

Note: Existing home sales, year-on-year price change


At one new development in the city’s west, interested parties had to temporarily transfer 1 million yuan ($157,000) and upload personal credit reports before they could even make a bid.

Many of those who managed to do so—not easy, with queues of bidders snaking around the block at bank closing time—still didn’t even get their offers considered.

Under pressure from the local housing regulator to prioritize residents, local developer Coaster Group decided to vet applicants on how long they’d paid taxes in the city. The 2,114 successful applications all had more than 23 years of tax records.

That meant renewed disappointment for many, including Jerry Huang, 29, who has 14 years of Shenzhen tax history. It’s the third time that non-monetary requirements have prevented him from even making a bid.

“It looks like I have to shelve the purchase plan for a long time,” Huang said. “There are so many people competing I’m not sure I have a winning chance.”


— With assistance by Emily Cadman, Ari Altstedter, Olivia Konotey-Ahulu, Charlie Wells, Emma Dong, Nabila Ahmed, Prashant Gopal, and Oshrat Carmiel

(Updates with Australia housing market figures in 14th paragraph.)
These Are the Best Real Estate Markets for Avoiding Bidding Wars

(Source: bhg.com)  

In the 2021 housing market, real estate has become so competitive that bidding wars and cash offers are commonplace. Here are the areas in the U.S. where you can still find an affordable home.

By Meena Thiruvengadam

June 29, 2021


In the 2021 housing market, real estate has become so competitive that bidding wars and cash offers are commonplace. Here are the areas in the U.S. where you can still find an affordable home.

It's no secret that real estate has become extremely competitive in many areas of the United States. Bidding wars, cash offers, and personal pleas of all kinds have become parts of the housing market as much as saving for a down payment, finding a lender, and signing piles of paperwork. But there are still a few places in the U.S. where home buyers can catch a break.

While U.S. home prices continue to rise nationwide, the National Realtors Association has identified several markets where home price increases have been less steep—and inventories less squeezed.

To come up with its comprehensive list, the National Realtors Association looked for cities of more than 50,000 people where home prices had risen less than 10% over the past year. It limited each state to one city to include a broader range of geographies and factored in the number of available real estate listings.

"It's not necessarily fun to be in one of the most competitive markets in the country," says Danielle Hale, the National Realtors Association's chief economist.

One tip she has for homebuyers in particularly competitive markets? Look at nearby places that could provide realistic alternatives. "They can be very affordable, but still not too far away from the cities you might want to be in," she says.


Skip pricey West Coast markets.

Other places on the National Realtor Assotiation's list of best markets for buyers include: Iowa City, Iowa; Stamford, Connecticut; and Tuscaloosa, Alabama.

"The South, Midwest, and Northeast is where we tend to find more affordability and also more listings," Hale says. "The markets out West have recently been moving super fast-—especially in alternatives to the traditional pricey markets."

Notable is the fact that no city west of Las Cruces, New Mexico, made the list—and only a few locations are even west of the Mississippi River.


Consider nearby communities.

A 12.5% decrease in listing prices over the past year earned Hoboken, New Jersey—which had just nine listings available for every 1,000 area households—a spot on the list.

Hoboken is just across the river from Manhattan, making it a popular alternative to New York City. And while Hoboken's median March listing price of $784,500 isn't exactly cheap, prices are lower than across the Hudson River in the heart of the city that never sleeps.


Find bargains in college towns.

To find a home for less than $300,000, consider Springfield, Illinois, where the median listing price in March was $121,450—a 4.2% decrease from the year prior. The Illinois capital is located in a state that's been experiencing steep population declines. For homebuyers, that's translated into better availability and affordability.

For warmer weather with your real estate deal, consider Tuscaloosa, Alabama—home of the University of Alabama. The median listing price in March was $248,700—an increase of just 3.2% from the previous year. Still, housing inventory in Tuscaloosa isn't what it used to be: There were just eight home listings available per 1,000 residents in March. The properties that are becoming available in Tuscaloosa, however, are sitting on the market for an average of 46 days—giving buyers at least a little bit more breathing room in this booming real estate market.

Here’s why there aren’t enough Bay Area homes to buy

(Source: mercurynews.com


Silicon Valley among the worst in U.S. at building homes to meet needs


By LOUIS HANSEN  | Bay Area News Group

PUBLISHED: June 22, 2021 


The Bay Area has one of the worst records in the country for building enough housing for its booming workforce, putting the region atop another national ranking for housing misery.

Between 2010 and 2020, the core Bay Area added roughly 6 jobs for every new home or apartment, one of the worst ratios in the country, according to a new analysis of census data by Apartment List.

The only regions with a worse ratio of job creation to housing construction were rust-belt cities — including Detroit, Cleveland, Toledo and Dayton, Ohio — where existing homes provided ample living opportunities to rebounding midwestern economies.

A healthy market should be adding a new home for every job or two, said Apartment List chief economist Igor Popov. “We’re really not building enough to keep up with job creation,” he said. “It’s a sad song we’ve sung before, but we freshen it up every once in a while.”

The analysis suggests a deeper Bay Area housing crunch, where rising prices for homes and apartments push more residents out of the region. With few homes on the market and a strong tech economy, Bay Area home prices have already hit record levels, topping a $1 million median price for a single family home in March and April.

Although rents remain among the highest in the country, they have fallen during the pandemic, as professionals quit higher-end properties and choose cheaper, more spacious accommodations to work remotely. The outward migration has pushed Bay Area residents into less expensive regions of California, usually outer suburbs and the greater Sacramento area.

The California housing crisis has been a boon to western states, Popov said. The top five fastest-building U.S. cities during the last decade were places popular with California transplants: Provo, Utah (30% increase in homes and apartments), Austin, Texas (29.4% increase), Raleigh, N.C. (23.5%), Boise, Idaho (22.5%), and Houston (20%), according to Apartment List.

Home prices in April jumped 27% in Idaho and 18% in Utah from the previous year, according to CoreLogic. California prices grew 13%, the same as the national median.

Between 2010 and 2020, the San Jose metro area built 48,000 new homes and apartments, increasing its housing stock by 7%, according to Apartment List. At the same time, the robust South Bay economy added 280,000 jobs. About 92,600 new homes were built in San Francisco and the East Bay, a 5.3% increase. That region added 546,000 jobs, flooding more people and families into an already tight housing market.

Surveys of renters find that affordable home ownership is a top concern for residents when choosing a region, Popov said.

RELATED ARTICLESCalifornia renters locked out of 7,677 homes despite eviction banMuch-needed Oakland housing held up over three parking spotsFederal agency demands closure of massive San Jose homeless campSausalito police clear homeless camp in tense crackdownHomebuyer fatigue? Bay Area home sales slow as prices soar

The imbalance between Bay Area jobs and housing might be getting worse, by some standards. A study by the Bay Area chapter of the Building Industry Association found the region grew by 4.3 jobs for every new housing unit in the shorter period between 2011 and 2017.

The pandemic has also slowed construction across the Bay Area. Residential permits for new homes plummeted by one-quarter between 2019 and 2020. Pandemic safety measures slowed construction schedules, and higher labor and material costs drove up prices by about 20%, builders said. They worry the pandemic could have a ripple affect and slow down projects in future years, as well.

Paul Getty, CEO of San Jose real estate firm First Guardian Group, said investors are continuing to take advantage of the sellers’ market and leave the Bay Area. Many of his clients are small landlords eager to cash-in on their investment.

Getty is seeing more single family home rentals being converted into owner-occupied family homes in recent months, further reducing the supply of affordable rental housing. He said the region is clearly not addressing its housing needs, but added, “I’m not one to write off the Bay Area.”

Trendspotting: The Lasting Impacts of Remote Work

(Source: naahq.org)  

July 2021
By Paula Munger


While the debate continues concerning the future of work, two things are clear for the apartment industry: The prospect of remote work will affect an organization’s recruitment and retention efforts as well as the way communities are marketed and managed long after the pandemic.


According to KPMG’s Q1 2021 “CEO Pulse Survey,” 24% of CEOs said their businesses have changed forever, while 16% said they have plans to downsize their office footprints, down from 69% in August 2020. While at first blush these findings may seem contradictory, the reality is that they reflect the rapid pace of disruption caused by the pandemic and the attendant uncertainty in the marketplace.


Teleworking Takes Off

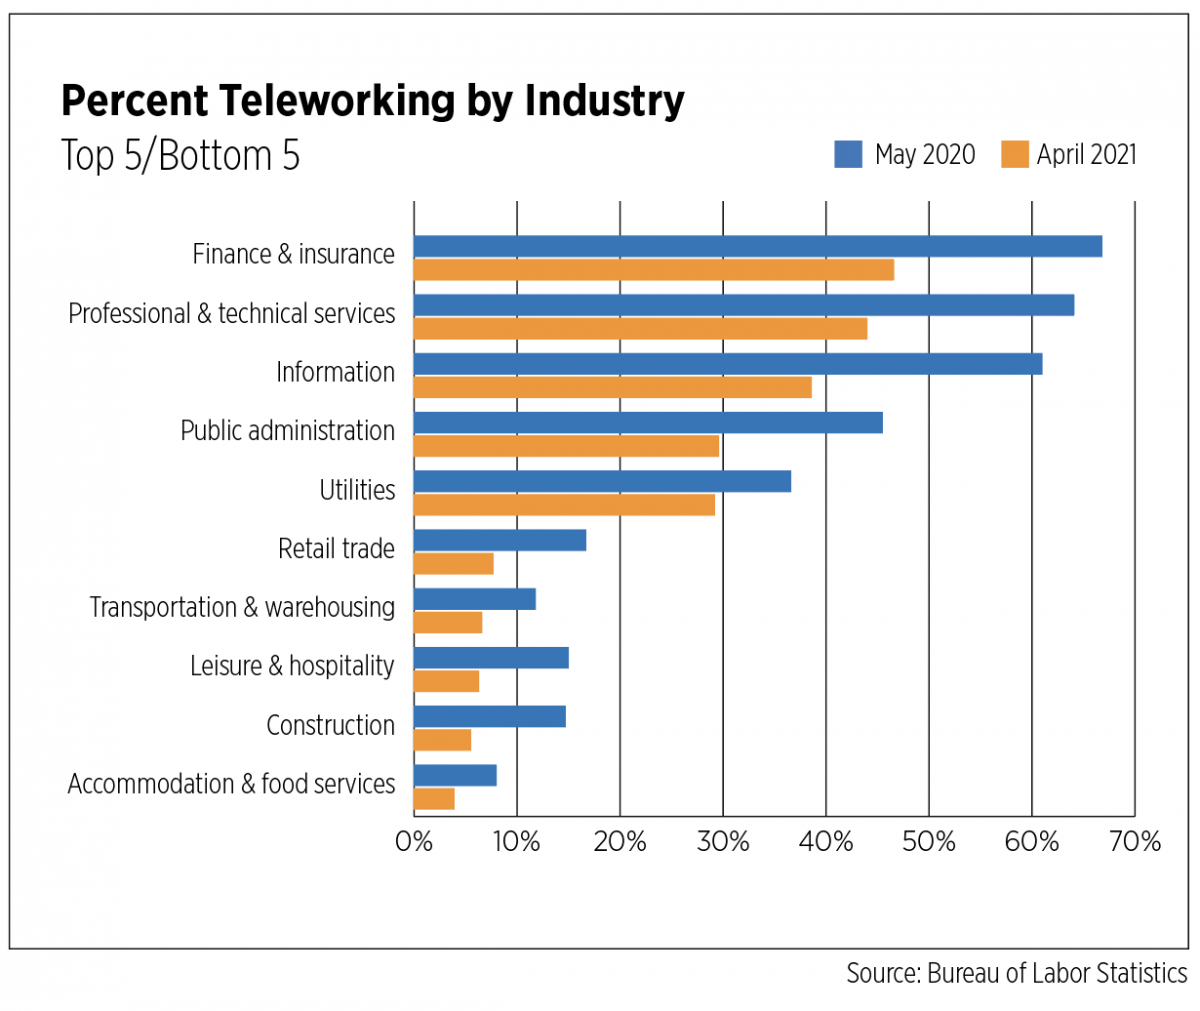
In May 2020, the Bureau of Labor Statistics began tracking telework in its Current Population Survey. At its peak that month, nearly 50 million employees, or 35.4% of the workforce, were working from home. Aside from an uptick during the winter months, that figure has been steadily declining and in April 2021 measured 27.6 million employees (18.3%).

Experiences with telework vary greatly depending on level of education and industry. In May 2020, only 15.3% of high school graduates were working remotely, compared to 68.9% of those with advanced degrees. Eleven months later, those figures had dropped to 6.2% and 40.6%, respectively. Industry sectors disproportionately affected by the pandemic have been well-documented. Those same industries—leisure/hospitality, restaurants and brick-and-mortar retail, which rely on face-to-face interactions—obviously have fewer options for remote work. In the same vein, occupations that require use of special equipment or are intrinsically tied to a physical place, such as a construction site, also have fewer options for remote work. On the other hand, finance, professional services and the like witnessed more than 60% of their workforces working remotely at the height of the pandemic. 1


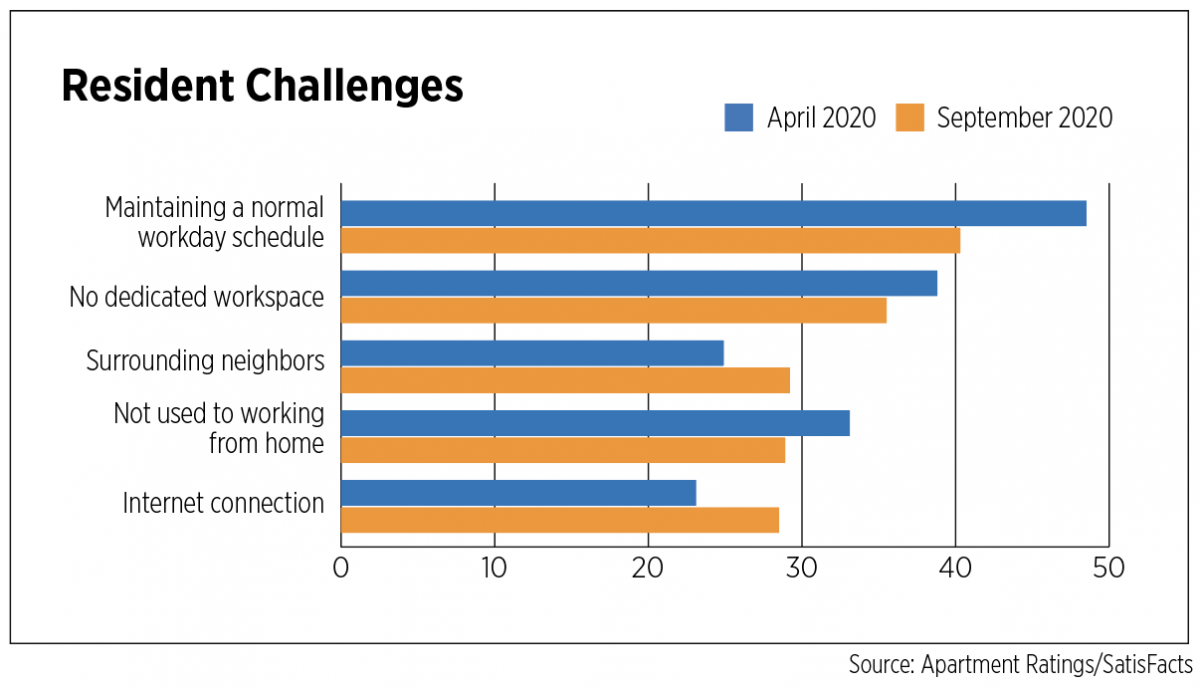
Apartment residents across the country who had the ability to work remotely were suddenly faced with outfitting their homes to make space for an office as well as learning spaces for their children. ApartmentRatings/SatisFacts conducted monthly surveys of more than 150,000 renters between April and September 2020, and one of the many questions measuring the impacts of the COVID-19 crisis on apartment residents centered on the challenges of working from home. As a whole, the top five challenges did not change much between the first and last survey, but there was some movement of rankings within those five. Maintaining a normal work schedule, a lack of dedicated workspace and surrounding neighbors were the top challenges by September. These challenges become very important when considering motivations for moving residences during the pandemic. 2


Telework Impacts Everything

Remote work clearly has profound impacts on office space, but its effects on the built environment are far-reaching. Retail establishments in urban cores that rely on 9-to-5 foot traffic of office workers and commuters saw sales plummet, even after lockdowns were lifted. According to an Ernst & Young study commissioned by the Greater Washington Partnership, a shift toward more flexible working in the D.C. metro area could result in a decline of up to 29% in consumer spending around their workplaces.

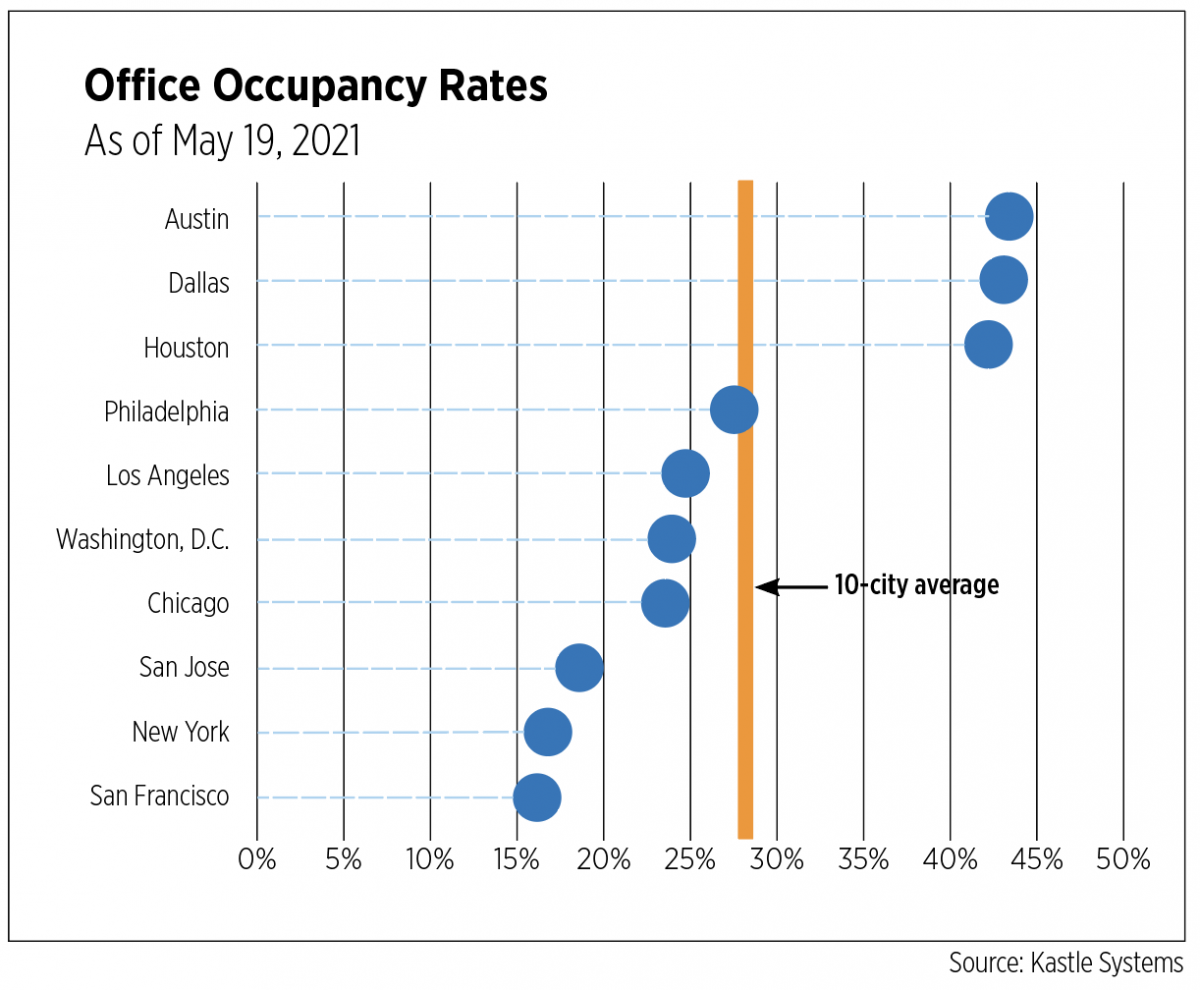
The office sector continues to feel the pain inflicted by remote work. According to Colliers, office absorption across the country broke a quarterly record in Q1 2021, at negative 46 million square feet. But conditions vary across markets, which can be plainly seen in occupancy data collected by Kastle Systems. Occupancy rates as of May 19, 2021, were above 40% in Texas cities but remained below 20% in New York City and the Bay Area. In addition to the type of work and whether it can be conducted remotely, local restrictions certainly play a role in workers’ mobility. Kastle Systems data most recently show occupancy rates averaging 28.1%, a troubling sign for the office sector amid strong vaccination rates and lapsing restrictions, and an indication of just how long a recovery could take. 3

Comparatively speaking, the apartment sector has held up well, particularly for larger, institutionally-owned properties outside of a few urban core areas. CBRE reported net positive absorption of 191,400 units for Q1 2021, a decline from the prior year but firmly in positive territory.


Affordability and Space Rule

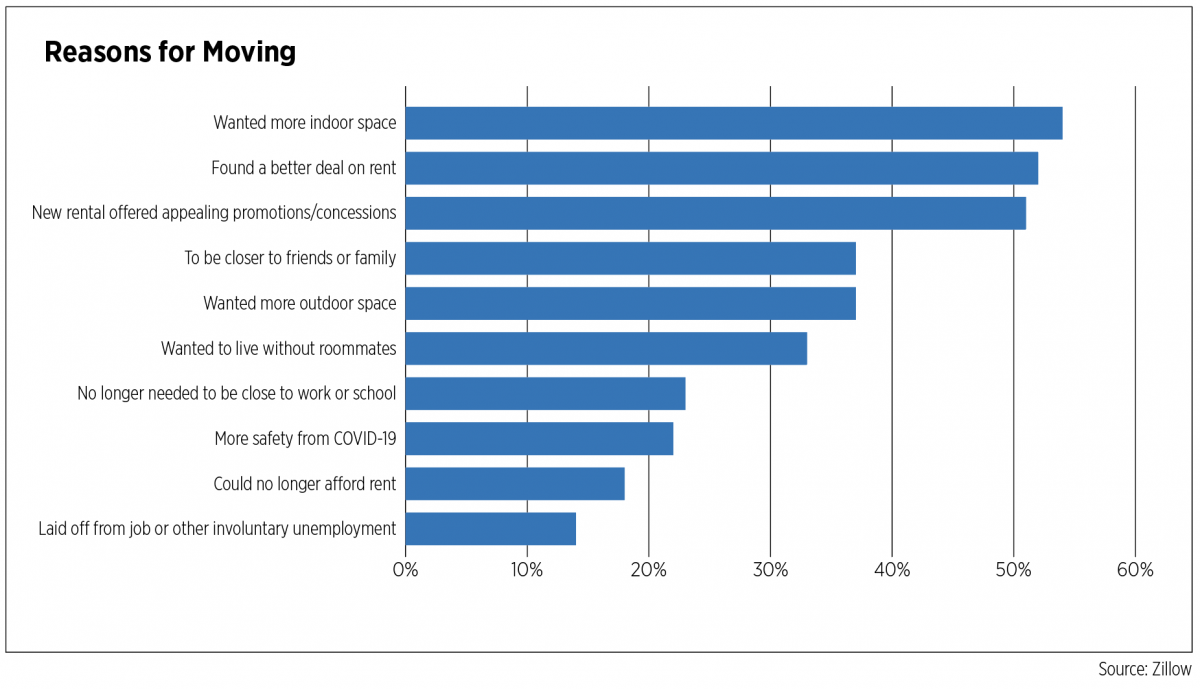
In survey after survey of renters, the top reasons given for moving during the pandemic were related to having more space or lowering costs. Zillow surveyed renters in December 2020, asking them the reason for moving during the past year. The top four reasons all had to do with either more space, both indoor and outdoor, or better pricing, either through concessions or simply lower rent.

A more recent survey from RENTCafé revealed the number one reason for moving during Q1 2021 was to find a better deal. While this might seem obvious, finding a better deal placed further down the list, tied for fifth, for those who moved during the pandemic. At that time, more movers cited their lease ending and needing a change of scenery. 4

Developers are already adjusting plans, according to “Nooks, Balconies and Beyond: Rethinking Multifamily Design Post-Pandemic,” published by Newmark in December 2020. The survey of apartment developers found that 14% of units in proposed projects had already been retooled to accommodate more space for working. The one-bedroom-plus-den design, which had fallen out of favor pre-COVID, is making its way back into designs as developers anticipate strong demand for this unit type, which offers workspace without the price tag of a two-bedroom unit. One developer is building balconies for 70% of their units compared to 50% prior to the pandemic. Finally, some developers are looking at 76-foot floor plates versus the standard 65 feet to accommodate larger and more flexible spaces.

The old adage, “Location, location, location,” loses its significance in a work from anywhere environment, particularly taken together with the loss of amenities in many urban locales. It should have come as no surprise to learn that month after month, Americans were on the move – some staying close enough to be able to get to the office when needed, but others moving clear across the country. There is no shortage of reports and studies documenting these moves, some of which were temporary, but most have one thing in common: Smaller cities and suburban locations gained population at the expense of larger downtown areas.

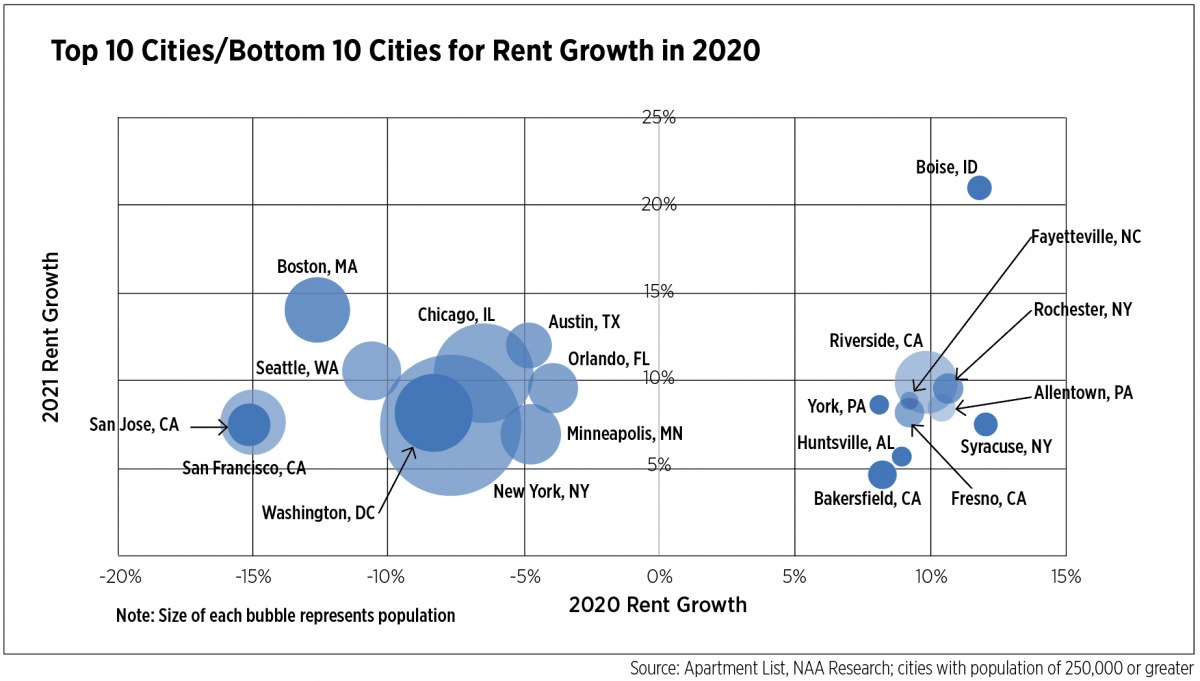
These trends were reflected in the apartment market. Analyzing monthly rent data from Apartment List revealed that the top 10 markets with the greatest rent growth in 2020 had a median pre-pandemic rent of $981 and a median population of 764,000 people. In contrast, the 10 markets to suffer the greatest rent declines had a median pre-pandemic rent of $1,753 and a median population of 4.2 million. It should be noted that in March 2020, the chart on the opposite page looked very different for the larger cities when comparing 12-month rent growth to three-month rent growth. The result was that all these cities appeared in a lower left quadrant, that is, negative over both the short- and longer-term time frames. But thus far in 2021, rent growth has been positive in all 20 of these markets, making it clear that larger cities are beginning to turn a corner. Still, for a market like Boise, Idaho, rent skyrocketed 33% from February 2020 to May 2021. 5


Winners and Losers

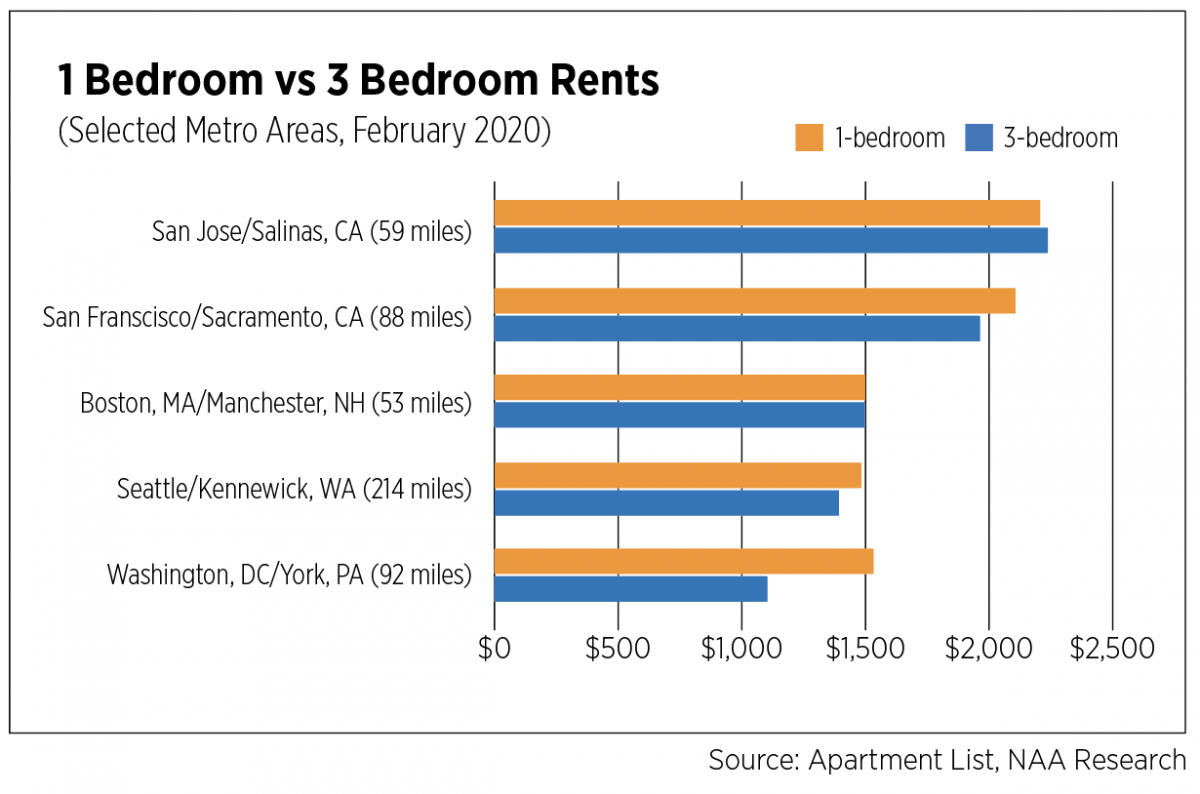
Tech workers moving from Silicon Valley to Idaho was a trend before the pandemic. A three-bedroom apartment in Boise, which has appeared on numerous “top” lists during the pandemic, rented for $1,146 in February 2020, while a one-bedroom in San Jose, Calif., was $2,206. But one did not have to make a 700-mile move to achieve lower rents. In some areas, a move of slightly more than 50 miles could get a resident two additional bedrooms for the same price. The chart to the right pairs the five markets with the greatest rent declines in 2020: San Jose, San Francisco, Boston, Seattle and Washington, D.C., with five nearby markets. With the exception of the Seattle example, a move of fewer than 100 miles could result in significantly more space for about the same or lower rent. These less expensive markets experienced healthy rent growth in 2020, ranging from 5%-8%. 6


Numerous reports have been published in recent months documenting moves out of larger cities and into smaller cities or suburbs. Both United Van Lines and North American Van Lines reported similar migration patterns compared to prior years, illustrating that the COVID-19 crisis was an accelerator rather than a catalyst, a phenomenon seen across demographic, economic and societal trends. Both moving companies’ surveys listed Arizona, Idaho and North Carolina in their top five for inbound migration while identifying California, Illinois, New Jersey and New York in the top five for outbound migration. The United Van Lines study found that a new job or job transfer remained the number one reason for moving, although the percentages of movers specifying it was down from prior years. The second reason for moving, to be closer to family, was chosen by 27% of respondents, a significant increase from prior years’ surveys.


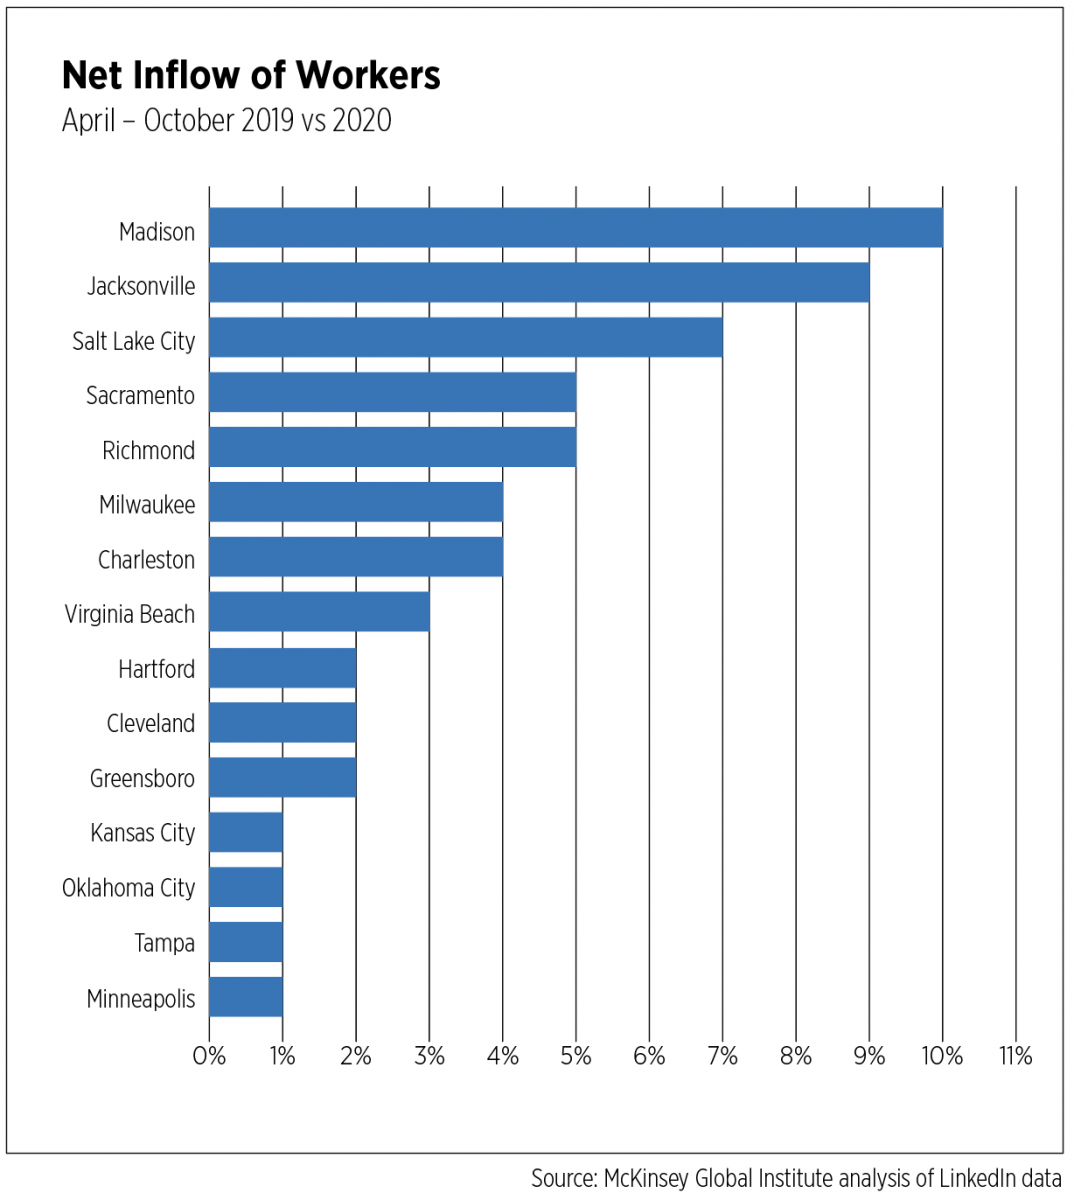
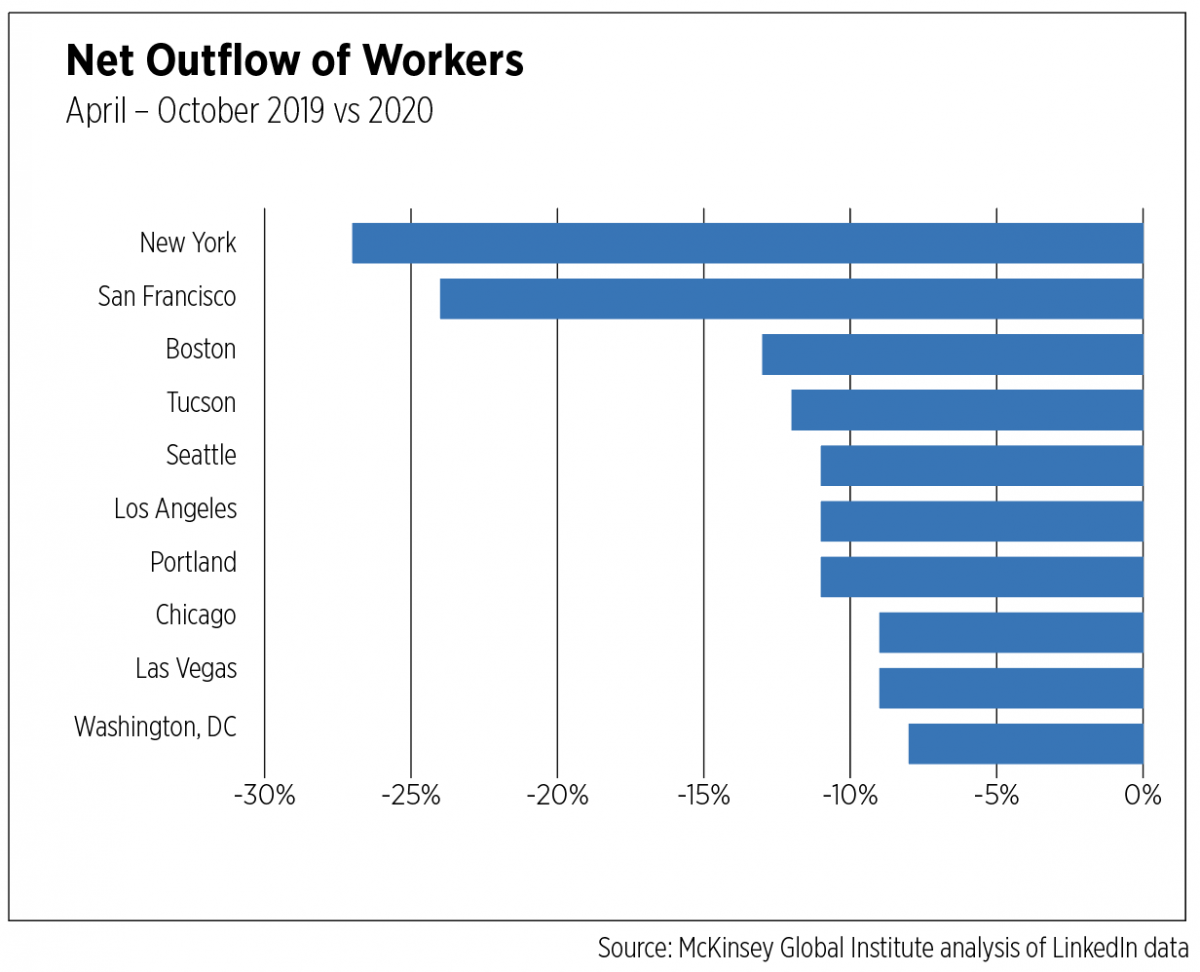
In their report, “The Future of Work after COVID-19,” the McKinsey Global Institute analyzed net inflow and outflow data of workers based on LinkedIn data. The inflow-outflow ratio represents the number of people moving to a market area compared to those moving out, based on the locations LinkedIn members list on their profiles. Rankings reflected metro areas that exceeded a threshold of 10,000 overall moves in the period (Apr.-Oct. 2019 vs. Apr.-Oct. 2020) and are presented in the charts to the left.7/8


One of the more interesting aspects of this data is the metros with high inflow ratios are not all the “usual suspects” – that is, Sunbelt or Western cities. In fact, they represent all regions of the country including the Northeast. This certainly fits with the motivation for a move being closer to family, more space or more affordable housing options rather than a job, as cities such as Hartford, Conn., and Sacramento, Calif., had some of the highest unemployment rates in the country throughout the pandemic.

The cities in the net outflow chart, on the other hand, match many other studies and data, with few exceptions: Large, expensive gateway cities on both the East and West Coasts, and Chicago—all experiencing pandemic out-migration and weaker economic and real estate market conditions, in general.

Investors still like the Sunbelt, as CBRE’s 2021 Investor Intentions Survey showed. For all types of property, Austin, Texas, Dallas, Los Angeles, Phoenix and Denver topped the list for investment preference in 2021. Phoenix and Miami moved up the most in rankings from the 2020 survey, up five places and three places, respectively. At the other end of the spectrum, Boston plummeted nine spots while Orlando, Fla., lost favor as well, slipping seven spots.


There is already evidence that some pandemic moves were temporary, and people are moving back home; many of those who moved permanently moved close to home. According to a Bloomberg analysis of U.S. Postal Service change of address forms in the 50 most populous cities, 84% of people who moved during the pandemic moved within the same metro area. While this will certainly have implications for a municipality’s coffers, the level of economic activity in the region remains unchanged.

As far as the oft-discussed urban exodus, the Bloomberg analysis as well as that of the Federal Reserve Bank of Cleveland found that this is largely isolated to two cities: New York and San Francisco. San Francisco’s rate of permanent moves increased 23% from March 2020 through February 2021, compared to a national average of 3%. In New York, 79% of those who moved permanently did not leave the metro area, but the city’s temporary move rate spiked 138% during the depths of the pandemic, providing plenty of fodder for the “urban exodus” discussion. The Fed study further found that the decline in inflows into cities almost always outweighed the increases in outflows, meaning that fewer people moved into cities during the pandemic than normally would have—which completely changes the exodus narrative.


TabularChart

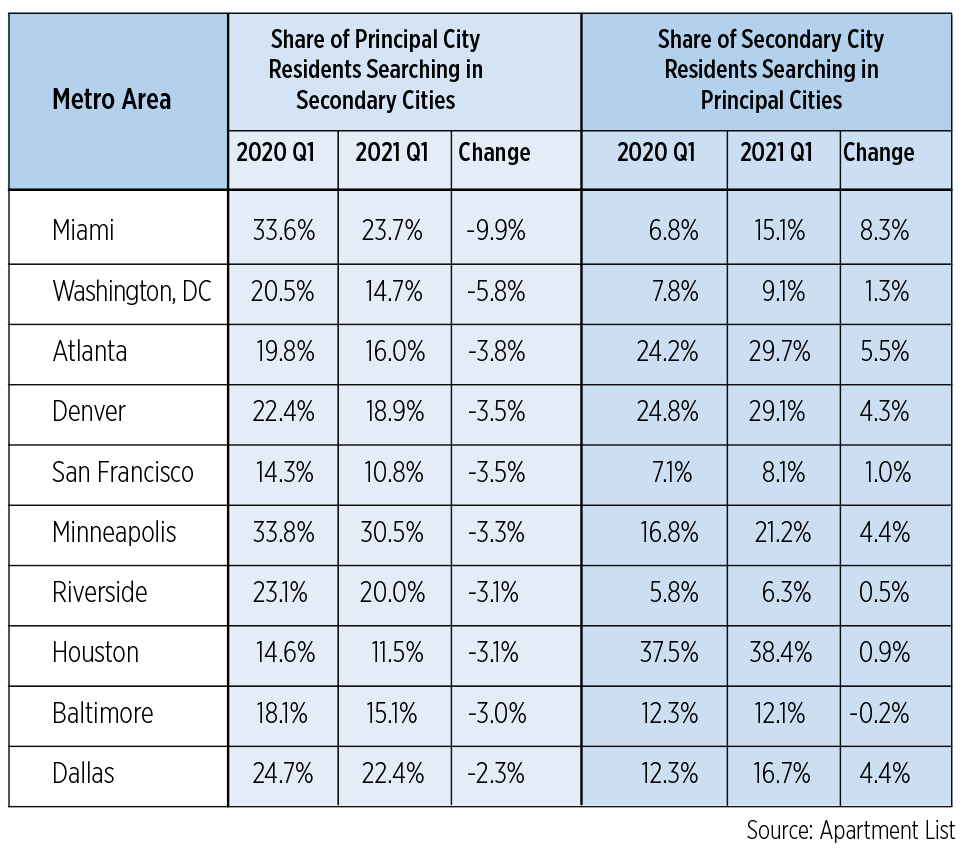
Apartment List’s most recent renter migration report, which analyzes apartment searches, found that on net, more renters are searching in larger cities in Q1 2021 compared to the same period last year. The table above shows the 10 cities that had the greatest declines in renters searching to move away from principal cities to secondary cities. The Census Bureau defines principal cities as the largest city within a metro area and secondary cities as all other cities within a metro area. While these data do not represent actual moves, they do show renewed interest in larger cities, some of which may be driven by pandemic-induced rent declines and concession packages, not to mention the return of amenities as restaurant, retail and entertainment options expand further throughout 2021.


What’s Next?

Remote work remains a fluid topic, like most everything else as the U.S. works its way through a global health crisis, an economic recession, an economic recovery and a decline in COVID-19 cases, hospitalizations and deaths. Recent data show that the movement of people across the country, much of it due to remote work, shows no signs of letting up. Property management software provider Entrata found in a recent survey that 56% of renters plan to move in 2021 while 22% moved last year, with the top reasons being cost savings and more space. Of those who have already moved, 61% said it will last more than a year while one-third said it was temporary.

Apartment List surveyed 5,000 employees in early April with similar findings. Two-fifths of respondents plan to continue remote work post-pandemic with 19% expecting a hybrid model and 21% fully remote. Forty-two percent of remote workers say they plan to move during the next 12 months compared to just 26% of onsite workers. Thirty-five percent of remote workers say they plan to relocate to a more affordable market. Whether or not employees’ and employers’ expectations line up is one of the overarching unknowns. And while anecdotes suggest few companies are adjusting pay scales to match employees’ home locations versus office locations, a shift in corporate practices could have dramatic impacts on the movement to more affordable locales.

The debate continues as to whether work from anywhere will be a lasting byproduct of the COVID-19 crisis. Conflicting data abounds. For every survey of employees citing a majority wanting to work from home most of the time, there exists another indicating employees are eager to be in the office most of the time. But these contradictions only reinforce the argument that hybrid approaches to work will likely be the new norm. One thing is certain: The percentage of employees working from home will be much greater than it was before the pandemic, estimated at 6%-7% of the workforce by the Census Bureau and Bureau of Labor Statistics, respectively. Employers who offer no flexible options at all for positions in which telework is possible will find themselves with a far smaller pool of available talent.

Paula Munger is AVP of Industry Research and Analysis for the National Apartment Association.

Performances Surge in Luxury Apartments

(Source: realpage.com

by Greg Willett Posted Jun 22, 2021 

Leasing activity in the nation’s top-tier apartment properties has picked up notably during 2021, resulting in tighter occupancy and climbing rents.

Occupancy in the Class A product stock improved to 95.5% in May. That’s the strongest occupancy rate seen for this segment of the nation’s apartment inventory since October 2019, and it’s a big jump from June 2020’s low-point performance of 93.9% occupancy. On average, occupancy in Class A properties ran right at the 95% mark over the course of the past decade.

What’s happened with luxury product rents is perhaps even more impressive than the bounce in occupancy.

Effective asking rents for Class A units are now rising at a year-over-year pace of 4.7%. Annual change was in negative territory from May 2020 to March 2021, with the loss getting as steep as -3.2% in September of last year. Luxury product rent growth averaged 3.1% annually during the past decade.


Today’s average rents for Class A apartments register at $1,862 a month, or $2.06 per square foot.


How Did We Get Here?

While aggressive new product deliveries in 2021 were expected to yield a competitive leasing environment in the Class A apartment category, robust leasing at the market’s new additions is leading to better-than-anticipated occupancy and rent growth.

Properties going through initial lease-up are moving an average of 25 to 30 units per month in most metros and often even more than that in high-demand Sun Belt locations like Dallas-Fort Worth, Phoenix, Atlanta, Austin and Charlotte. Monthly lease-up rates have doubled from the sluggish levels seen in 2020.

That demand momentum for new completions is allowing operators of properties in lease-up to keep use of rent concessions under control. Furthermore, most Class A properties with stabilized occupancy at this point aren’t even trying to match the rent giveaways offered at the new deliveries.

A drastic reduction in the amount of time a Class A unit sits vacant when there’s resident turnover is building confidence in pricing power. Stabilized (not new supply) luxury apartments that were leased in May had been vacant for an average of only 20 days, down from a peak 29 days of vacancy between leases in this product set during late 2020.


Demand from Affluent Renters Looks Good

While a portion of the nation’s populace has faced severe financial hardships during the past year, the higher-income households who can afford Class A apartments generally have fared well.

Those who make the most money tend to have the types of jobs that readily converted to work-from-home mode, so employment loss among those households was comparatively limited. In fact, job counts in high-paying employment sectors like Professional Services, Finance and the tech-heavy Information category are close to or even above pre-pandemic levels in many metros.

Furthermore, spending options for experiences like traveling and eating out were limited to some degree over the past year, so affluent households generally got even wealthier.

Individual lease transaction information from projects using RealPage’s property management platform shows the median annual income for a household leasing a Class A unit in May was at $93,000.


While job creation in high-paying employment categories appears to be the biggest influence on demand for luxury apartments, there’s likely also some impact from soaring prices in the for-sale housing sector. With declining inventories pushing up for-sale home prices, fewer renter households are financially qualified to buy, and those who can afford to purchase are struggling to find available product.

Top 10 Stats Capturing Today’s Crazy Apartment Market

(Source: realpage.com

by Jay Parsons & Greg Willett Posted Jun 21, 2021 in Executed Rent Growth, Lease Renewals, Rent Roll Revenue, Resident Acquisition

For most of us in the multifamily housing business, 2020 felt like a crazy year. And 2021 feels like another crazy year. But this time, it’s a good kind of crazy – so far.

Here are our top 10 stats best capturing the “good crazy” of the U.S. apartment market as we near the mid-year point of 2021. This is a summary from our recent webcast, which is available on demand here.

We’ll count them down from #10 to #1.

10: Concession Usage Peaked in COVID era at Just 16.8% of Units

Rental concessions continue to generate a lot of media and Wall Street buzz, but they’re decreasingly utilized. That peak of 16.8% of vacant units offering discounts occurred in May 2020 (excluding lease-ups, where concessions remain more common), and giveaways have lessened since then. For comparison, going back to the recession of 2008 and 2009, use of concessions spread to 54.7% of the available product.

Why are concessions going out of style? A few reasons. Occupancy held up better in 2020 compared to 2008 and 2009. The use of revenue management is much more common today, with revenue management systems have ushering in a shift toward effective pricing and away from free rent. And concession costs typically outweigh the benefits.

Concessions prolong the pain and delay the recovery. To that point, the markets where discounts were most widely available – San Jose and San Francisco – are the two markets that still recorded negative lease-over-lease rents on new leases as of May. In the hotter-demand Sun Belt, Houston is Exhibit A. Concessions were more common there, and of course, Houston trails other Texas markets in the 2021 rebound.

9: Apartment Payroll Expenses Are Flat Year-Over-Year

Apartment payroll expenses are flat year-over-year, comparing 1st quarter 2021 to the same time last year. How can that be? Salaries are going up. It’s hard to find good leasing agents and maintenance technicians. And when you do, you’re paying more to get them or keep them. So how can payroll expenses be flat?

Apartment property management companies are getting more efficient. Some of that is unintentional – we have too many open jobs. And some of it is intentional – COVID forced or inspired many property management companies to find more efficient and effective ways to manage on site by leveraging new technology like virtual leasing and tours and around vendor management, accounting and payments. We’ve also seen more property managers experiment with multi-site leasing teams.

8: Apartment Occupancy is Nearing All-Time Highs

Occupancy hit 96.1% in May. That is the highest May rate on record. Furthermore, it’s also very close to the all-time highs of 96.3% back in Fall 2019 and 96.5% in the tech boom days of late 2000.

Occupancy, of course, is seasonal and typically peaks at the tail end of the prime leasing season in August or September. That tells us there’s still some room for occupancy to climb this year, and we could set new all-time highs in the next few months.

We’re hearing from property managers who say they have virtually no availability in certain metros. To see this happening now is pretty remarkable when you consider that today’s job count is still close to 5% under its pre-pandemic high, and when new apartments are being delivered at the highest levels seen since the 1980s.

7: Apartment Lead Volumes Grow for 55 Consecutive Weeks

Leads are prospective renters who show interest in leasing, measured through guest cards. Some call it traffic. Now, you wouldn’t be surprised to hear lead volumes this year in March, April, May or June surpassed 2020 levels. But 55 consecutive weeks? That means lead volumes in the second half of 2020 consistently topped the levels seen in 2019 – which by the way, was a big year for apartment demand.

The sustained momentum is remarkable, and it helps explain why occupancy rates are so high and why new lease rents are going up.

6: Resident Retention Rates Plunged 360 Basis Points

Normally, a retention drop-off of that size would raise red flags. But in this case, it’s good news. Retention rates skyrocketed to record highs in 2nd quarter 2020 when renters couldn’t or wouldn’t move due to lockdowns. Retention has dropped off since then, registering at 55.3% in May 2021, which is still high by historical standards.

There are a few reasons that retention is falling. In big gateway cities and in some downtown areas elsewhere, low demand during the pandemic spurred deep rent cuts on new leases. Operators in some markets shot themselves in the foot by pricing new lease rents well below renewals, thereby incentivizing their existing renters to shop around and triggering a game of musical chairs between apartments in the same neighborhoods.

Additionally, re-opening economies and the returning jobs market is leading to more migration. That is perfectly normal and a good sign of the rebound. Ultra-high retention is never the goal, particularly in a high-demand market when new leases are priced well above renewals. To that point, renewal rents grew only 4.1% in May, about 50 basis points below the pre-pandemic norm.

5: Average Vacant Days Between Leases Hit Record Low of 21

Average vacant days is the length of time between a lease expiring and a new lease starting in the same unit. The number dropped to 21 in May. That is stunningly low. The decade average is 26. For the month of May specifically, we’re typically around 24.

In that period of time, property managers have to make repairs or upgrades. Often there’s paint and carpet work done, cleaning and of course, marketing and leasing the unit. Labor and materials are tough to pin down right now, so it’s remarkable that property managers are currently able to move so quickly and provide housing for the large numbers of households needing places to live.

4: Lease-Up Volumes Surging to Highest Levels Since the 1980s

Even though developers are having to scramble to get new projects across the finish line, we still appear on track to add around 400,000 market-rate units this year. That’s the biggest new supply volume seen since the 1980s. By comparison, developers completed 340,000 units last year – and that already was the high mark for this cycle.

For apartment demand to surpass multi-decade highs in supply, that’s a remarkable sign of strength.

While some had expected that construction starts would slow notably in 2021, we were never in that camp. And it’s looking like we were right. There were about 371,000 multifamily units permitted in the year-ending April. That’s off only about 5,000 units from the number seen one year prior. Money sources still view the apartment sector as a preferred option for capital deployment.

3: Apartment Sales Through April Reach 95% of 2019’s Record Pace

And speaking of investors, they’re hungry for apartments. the most recent data available from our partners at Real Capital Analytics, a total of $48.3 billion in apartments traded hands year to date through April. That’s back to 95% of the levels reported in 2019, which set the all-time high mark for apartment sales. It’s not totally crazy to think we might set a new record in 2021.

The sales that are occurring aren’t discount sales. We heard a lot last year about buyers waiting out sellers to scoop up bargain deals, but distress sales and bargains remain very rare. Cap rates have actually compressed 40 bps since the end of 2019, according to RCA.

One other point on sales. What makes 2021 different from 2019 is the composition of what is selling. In past years, big coastal markets and trophy assets in downtowns comprised a big piece of the pie. Those assets are generally less liquid in 2021 as more investors target the Sun Belt and the suburbs. There’s still a discount to acquire these types of deals relative to gateway cities, so it’ll take more total transactions to match 2019 sales volumes.

2: Apartment Renter Incomes Jump to Record High of $68,628

The median household income for market-rate apartment renters signing new leases reached a record high of $68,628 in May. That’s up significantly year-over-year … but since last May was a bit unusual due to lockdowns, we should probably take a more conservative measure. Compared to May 2019, incomes are up 7%. Bear in mind these numbers reflect only incomes at the time of lease signing.

Any time we talk about renter incomes and affordability, we need to also add a disclaimer. These income trends reflect renters of professionally managed market-rate apartments. Households with the lowest incomes typically do not live in market-rate rentals, and there are real challenges for those who make less than $30,000 or so annually as there’s a severe shortage of designated affordable housing. It’s important to be sensitive to that reality, while also noting that market-rate renters are typically in much stronger financial shape.

1: True New Lease Rent Growth Surges to All-Time High of 11%

Lease-over-lease rents on new leases surged 11% in May. That is an incredible number – by far the highest we have on record. Lease-over-lease trade-out, or replacement rents, reflect the change in rents from the previous occupant’s lease to the new one. The highest new lease rent number over the last cycle was 7.1% in June 2015. Of the nation’s 50 largest metros, 32 reached double digits in May 2021.

Unlike the traditional effective rent growth measure, trade-out is a seasonal stat, and we typically see the peak in May or June each year. So, we might peak a little higher in June, but we expect some modest softening later in the summer. But that would still be very high compared to historical standards.

The more traditional measure of rent momentum is change in effective asking rents – the list price minus the impact of a concession, if a discount is offered. Effective rents jumped 4.2% year-over-year in May.

We’ll likely see that number climb higher over the next few months as effective rents catch up with trade-out rents. We’ll likely top the previous cycle high of 5.4% set in September 2015. The all-time high was 7.5% set in 3rd quarter 2000. That mark is further out but still potentially attainable – particularly if we finally get some real price acceleration in the big coastal markets like New York, the San Francisco Bay Area and Los Angeles, which are pulling down the national average.

The most recent dish... enjoy!

How the IRS is trying to nail crypto tax dodgers

(Source: cnbc.com )  PUBLISHED WED, JUL 14 2021, 12:08 PM EDT; UPDATED THU, JUL 15 2021 2:00 PM EDT MacKenzie Sigalos  @KENZIESIGALOS KEY PO...

Popular Dishes